Creating and customizing graphs with Tanaguru Jenkins Plugin
Reminder: Plot plugin must have been installed.
Metrics available for graphs
Tanaguru Jenkins plugin exposes various metrics that can be graphed.
tanaguru-mark.properties: the score (Tanaguru Meter), percentage valuetanaguru-passed.properties: number of Passed tests, absolute valuetanaguru-failed.properties: number of Failed tests, absolute valuetanaguru-failedOccurences.properties: total number of occurrences of Failed over all teststanaguru-nmi.properties: number of Pre-Qualified tests, absolute valuetanaguru-na.properties: number of Not Applicable tests, absolute valuetanaguru-nt.properties: number of Not Tested tests, absolute value
Create a graph
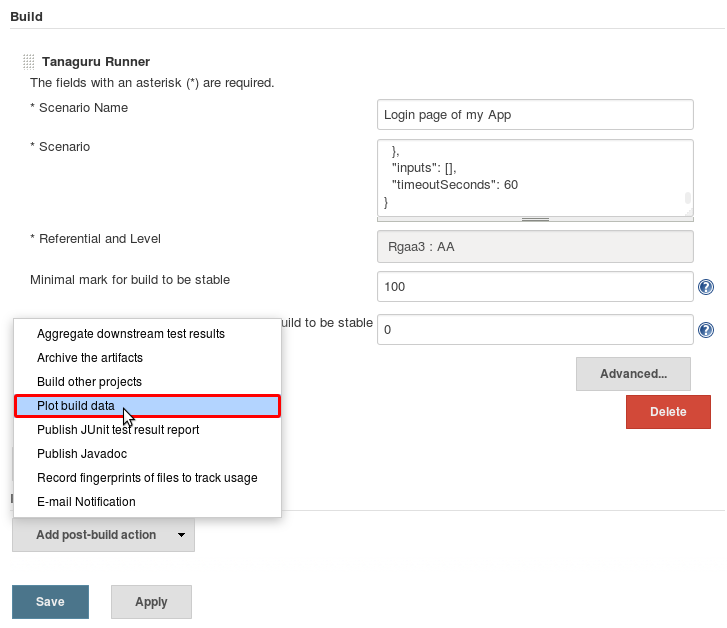
From the item page, go to Configure, Add post-build action and choose Plot build data.
Customize the graph
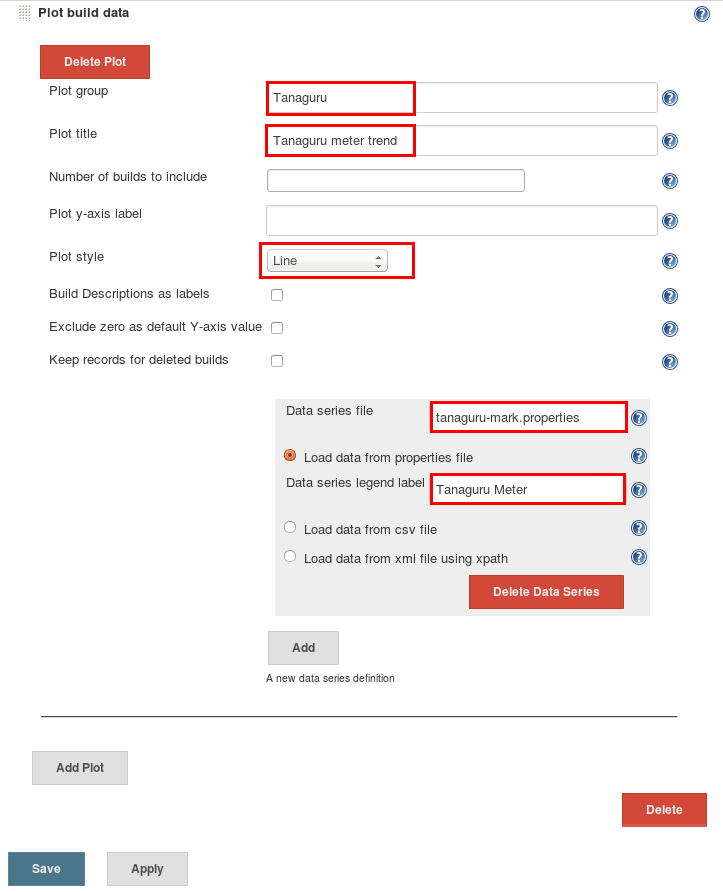
Fill in the following fields:
- Plot group: give a name, let say Tanaguru
- Plot title: let say Tanaguru meter trend
- Plot style: let choose Line. Other styles are available:
- Area
- Bar
- Bar 3D
- Line
- Line 3D
- Stacked Area
- Stacked Bar
- Stacked Bar 3D
- Waterfall
- Data series file: choose one of the Metrics available for graphs, let say
tanaguru-mark.properties - Data series legend label: let say
Tanaguru meter
Save, have some build done and view the graph.
View graphs
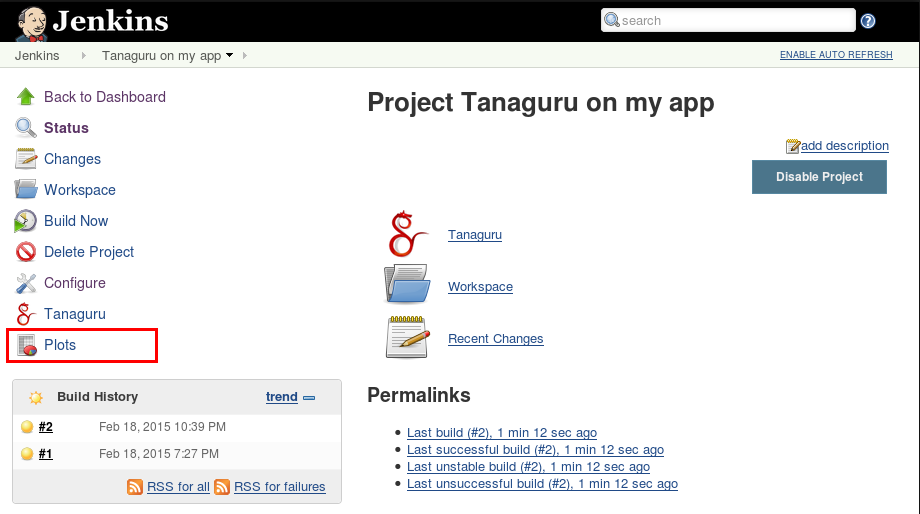
To view the graphs, from the an Item page, click on the Plots links
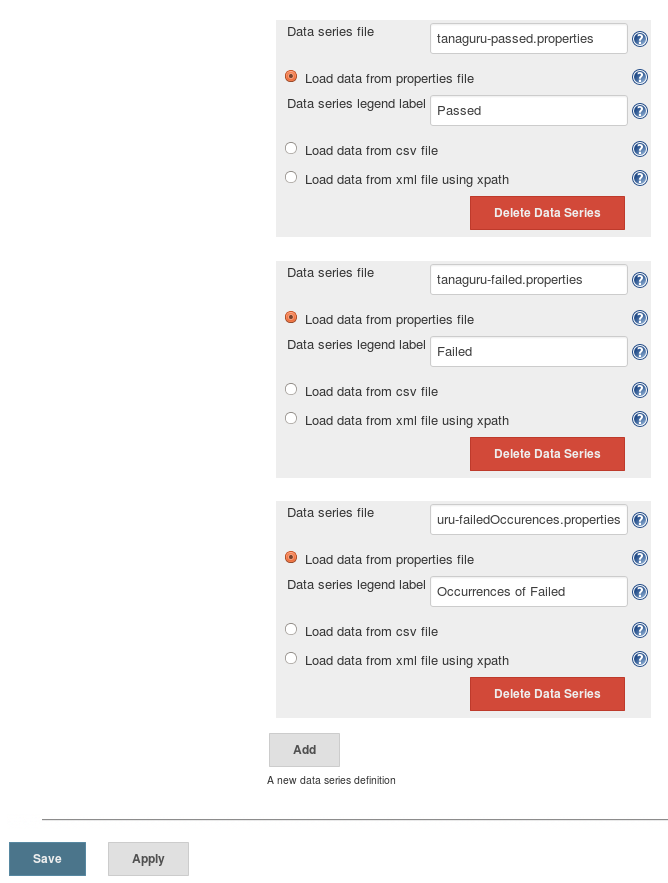
Different metrics on the same graph
When creating a graph, add several data series. For example, to graph the number of Passed, Failed and Failed occurrences, add three data series.
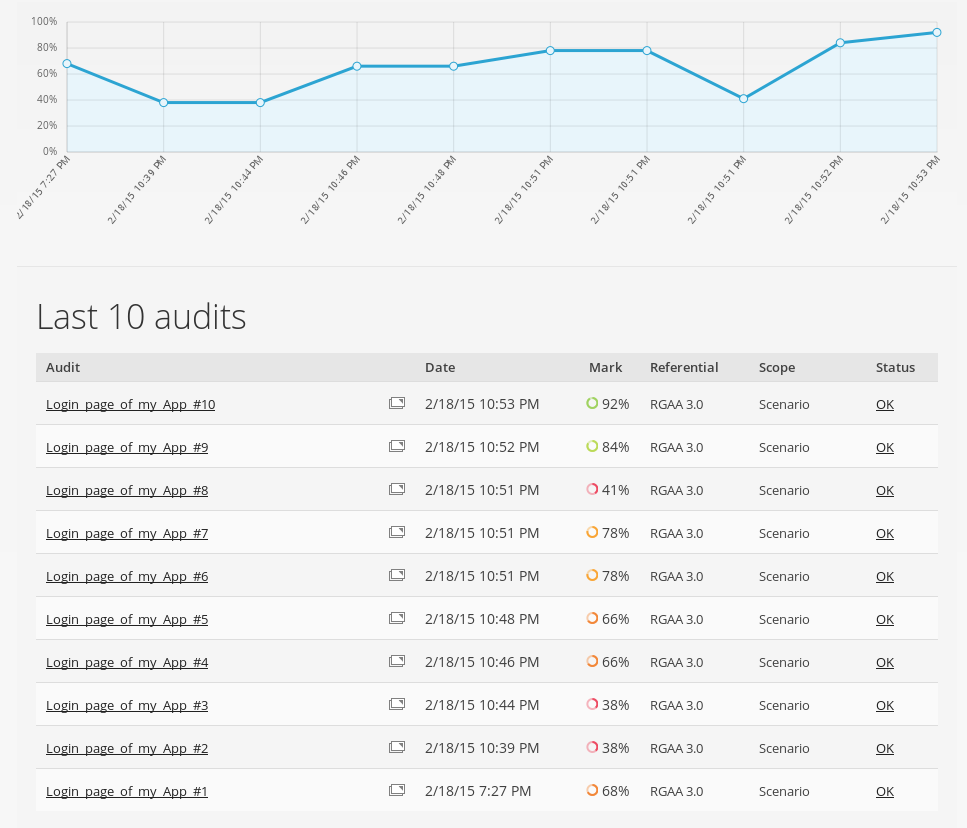
Example of graphs
Graphs generated by Jenkins
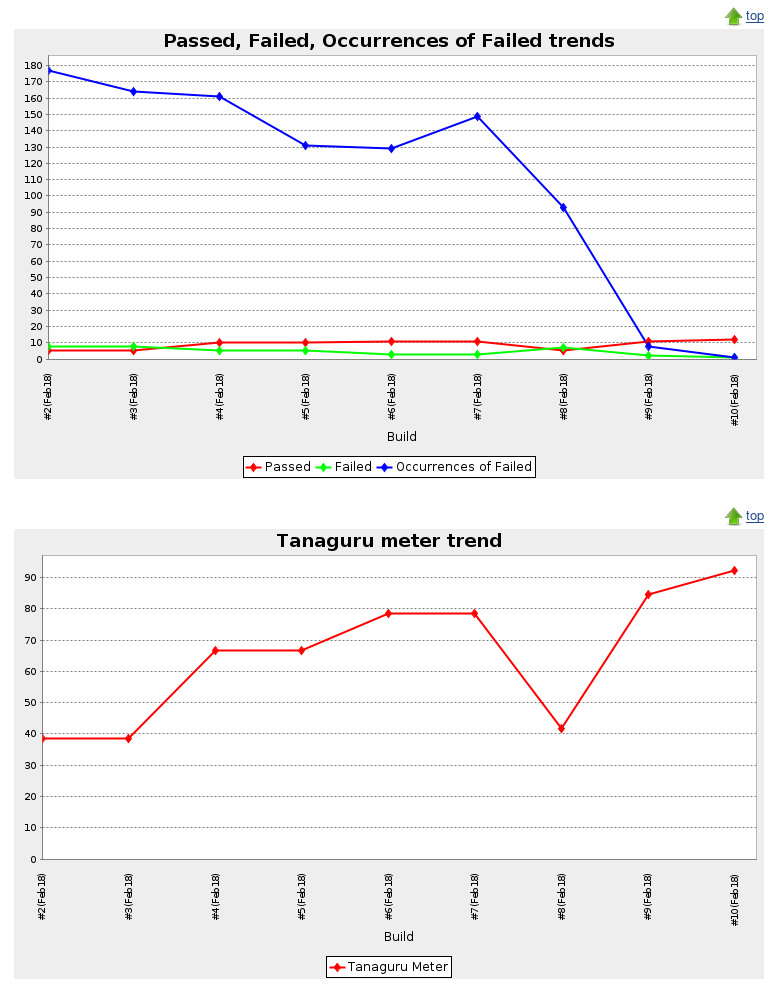
Same Tanaguru Meter trend graph from Tanaguru interface